Forex Chart patterns
Welcome to daily blogs with ValidUS!!!!
Prepare yourself to enter the trading world with the proper knowledge about the trading culture. Keep yourself up to date with the latest happenings about the Forex market with ValidUS.
Join ValidUS today!!!
Today we'll study a little about chart patterns.
Understanding how to read a chart and identifying trend patterns on the chart can help you make very successful trading decisions. Now technical analysis refers to the study of financial markets based on price movement. It uses the assumption that the price of a share or security reflects all the information about it that could share including the market set as well as its perceived value. Charting refers to technical analysis performed through careful inspection of price data to identify well-known patterns that emerge in share prices. For example, a head and shoulders pattern channels triangles and wedges. These are formations that we can see on the charts based on price movement. Chart patterns are well documented technical analysis literature and are based on the psychological phenomena that occur between buyers and sellers of financial instruments and liquid markets patterns. Formations don't form a trading system but rather provide an indication of the future trend of the asset as the price breaks psychological barriers in the form of support and resistance lines. So basically, chart patterns are just patterns that appear in place movement on the chart. There are numerous types of patterns, all names according to the shape that the price graph forms between the support and resistance lines. The general types of patterns include triangles, channels, wedges and head and shoulders. When these patterns develop, it's telling the trader that there should be a specific market reaction, whether it's a market reaction up or down, we don't know, but it tells us what is about to happen, and then when it does react, we it tells us what we can then expect of that pattern. So the most common chart pattern that traders look for are called triangles.
Triangles come in symmetrical triangles, ascending triangles, and descending triangles.
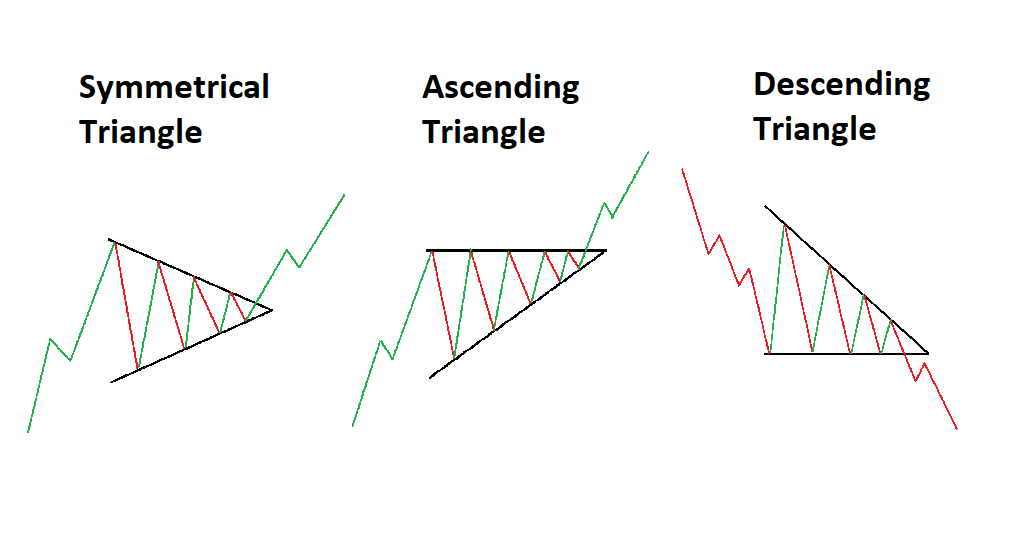
Now that sounds like a lot, but it's really in the direction of triangles going, as you see here on the left, a symmetrical triangle. The upper and the lower channels are an equal proportion or equal angles. In an ascending triangle, the support line is horizontal, and the trend line is on an angle coming up to it. In the opposite in a descending triangle, the support line or the resistance line depending on which price is moving is horizontal, and the trend angle then or the price channel angle then descends on it. But in all three cases, what is essential is number one to serve and recognize the pattern, and we can all see triangles pretty quickly and recognize the action because of what's happening, what this is telling you is. The price is being forced into this ultimate channel here. This ultimate tight squeeze and it's going to have to react when it gets to this point in a particular fashion as either going to break down, or it's going to break up. So it is the congestion of price movement in the pattern, so triangles form between converging support and resistance lines. A negative slope resistant line indicates a reducing level of profit-taking or more uncertainty about the value of a security. With a positive sloping support line, the price levels are squeezed into a corner. Once the supportive resistance line is broken, pressure built up as a result of uncertainty is released. A certain amount of momentum is added to the price change in the direction of The breakout, so if it breaks out this way and what we can expect is when it makes the break out for a short period of time, it's going to have some momentum behind it. So this would tell us when we recognize this pattern. We should be trading this asset going up and in the short term, not for a long term investment, so for binary options. It works very well to trade it in the next time frame, the next expiry or when it breaks down. You would trade it down because what is telling you is okay; the markets have now broken out. It'S not telling you the markets are not going to come like this. Go like that and go like that. But at the moment, it has momentum, and because it is pent up the momentum, either the Bears of the goals have now gathered the strength to break out for that little next shirt a little while it's going to have some momentum. So a breakout is one of the key things that traders look for and make a profit, and it's the momentum that is added to the price change in the direction of the breakout.
That's all for today, folks!!! Hope you enjoy your daily dosage of knowledge with ValidUS.
Spread this knowledge with your friends and family to attain the gift of fruitful learning.
Stay tuned for more updates!!! We'll be back soon.
Join ValidUS and receive webinar invites to get educated directly by expert professionals.
Don't let this opportunity slip from your hand.
Follow us on,
Website : https://teamvalidus.com/
Sign in : http://app.teamvalidus.com/auth/login
Telegram : https://t.me/ValidusOfficial
Facebook : https://www.facebook.com/validusGlobal
Instagram : https://www.instagram.com/validusglobal/
ValidUs
ValidUs
Comments
Post a Comment